Section 1.1 Graphs and Solutions of Equations
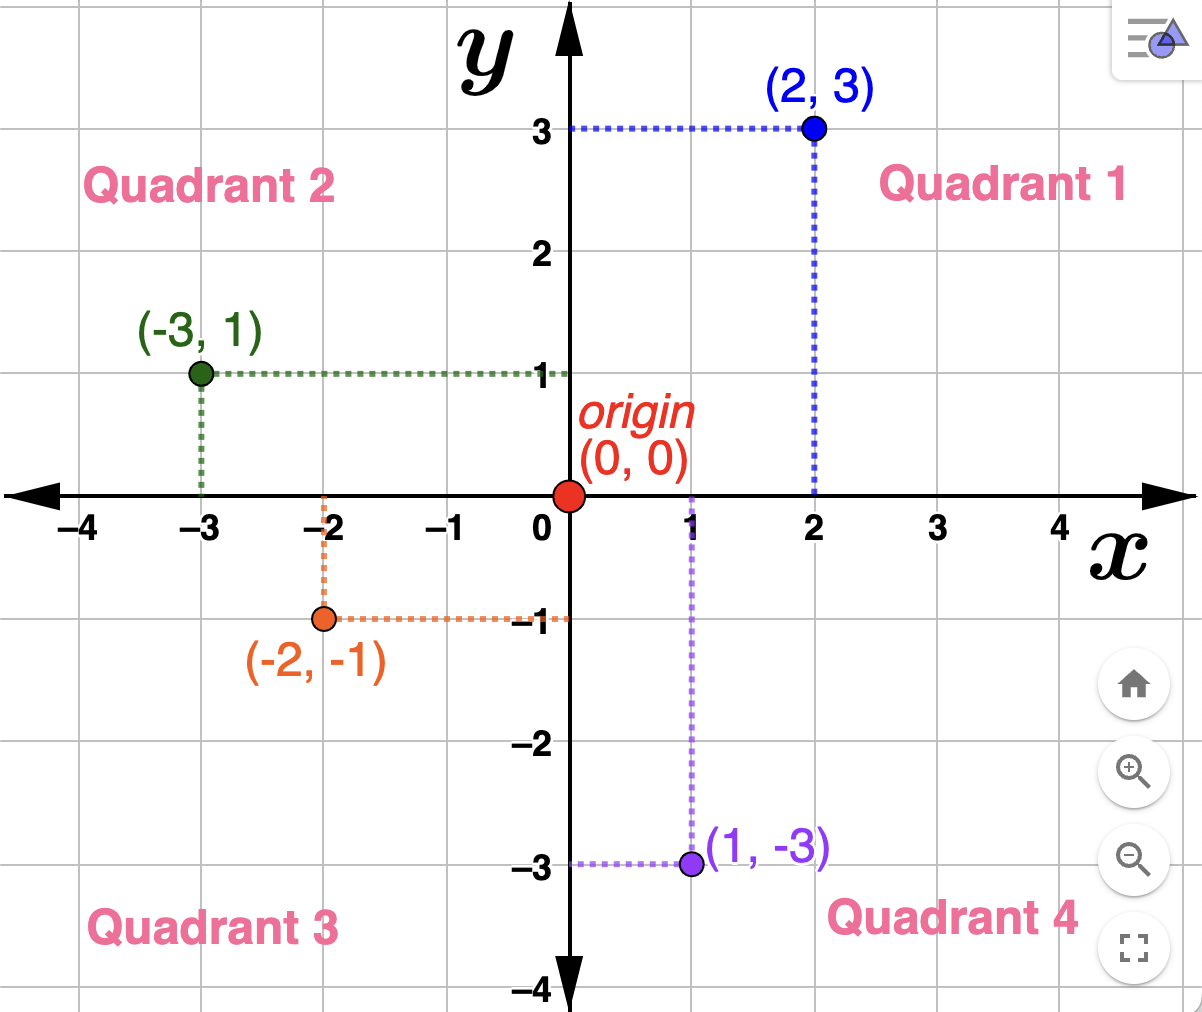
The Euclidean plane or rectangular coordinate system is formed by two perpendicular copies of the real line intersecting at the number \(0\) of each line. Each number line is called an axis. A point in the plane, called an ordered pair, is specified by (horizontal position, vertical position). The horizontal axis is often labeled \(x\) and the vertical axis \(y\text{.}\) The point \((0,0)\) is called the origin. The plane is divided into 4 quadrants, as pictured below.
The labeling of the horizontal and vertical axes is arbitrary. We can use whatever letters or symbols we want to name or identify each axis. However they are labled, ordered pairs will always have the form (horizontal position, vertical position). In the graph above each ordered pair has the form \((x,y)\text{.}\) In the example below, they have the form \((t,P)\text{.}\)
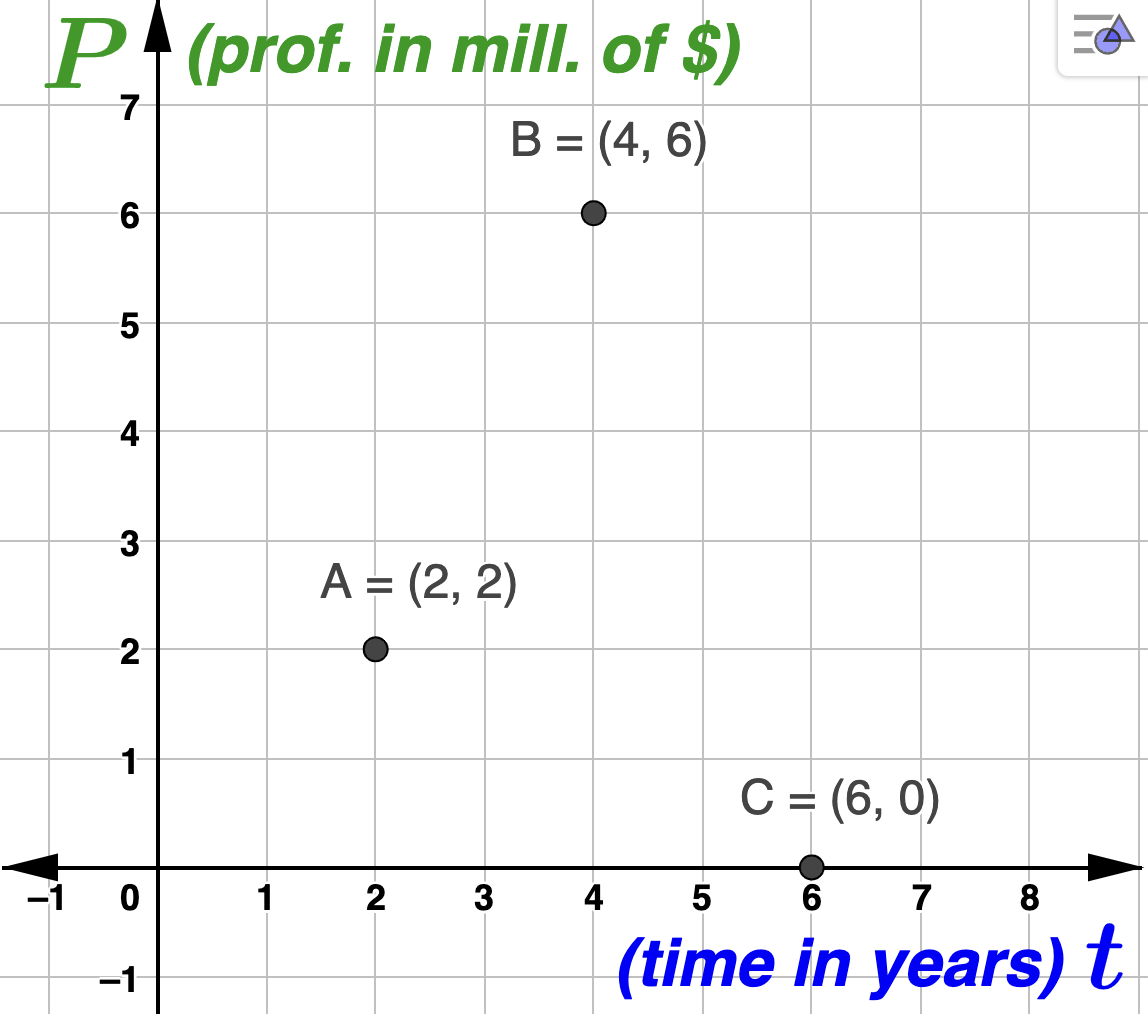
- Interpret the coordinates of point \(A\text{.}\) Solution.\(A = (2,2)\text{,}\) so that \(t=2\) and \(P=2\text{.}\) Since \(t\) is the number of years since 1999, \(t=2\) corresponds to the year 2001. Since \(P\) is ADTF Distributors' profit in millions of dollars, \(P=2\) corresponds to a profit of $2,000,000. So, point \(A = (2,2)\) in interpreted as: In 2001, ADTF Distributors made a profit of $2,000,000.
- Interpret the coordinates of point \(C\text{.}\) Solution.\(C = (6,0)\text{,}\) so that \(t=6\) and \(P=0\text{.}\) Since \(t\) is the number of years since 1999, \(t=6\) corresponds to the year 2005. Since \(P\) is ADTF Distributors' profit in millions \(P=0\) corresponds to a profit of $0. Another way to say a company's profit is $0 (no profit, no loss) is to say that the company broke even. So, point \(C = (6,0)\) in interpreted as: In 2005, ADTF Distributors broke even. Note that negative profit will be interpreted as a loss.
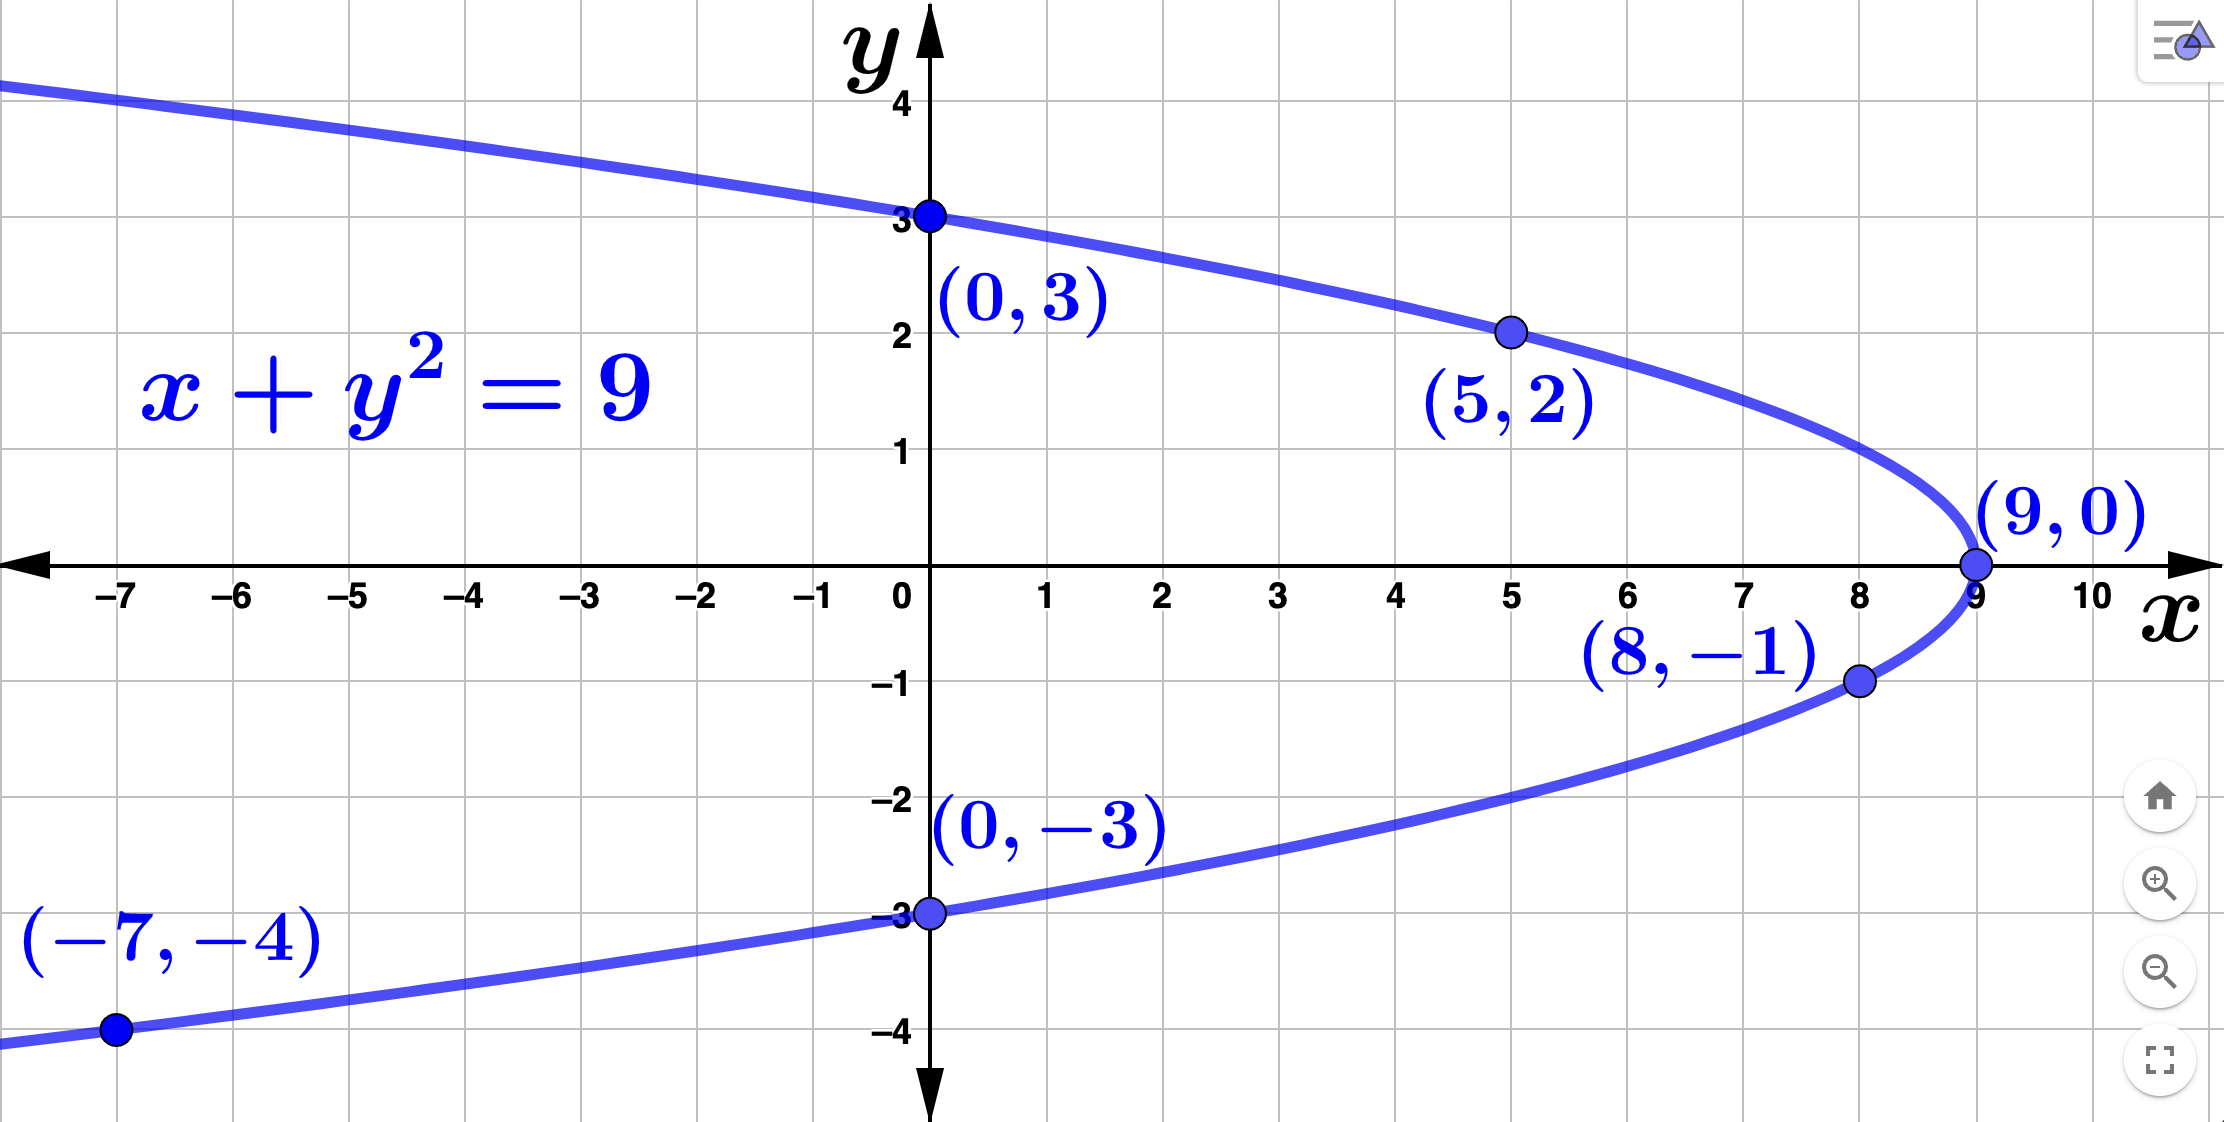
When we have an equation with two variables, usually \(x\) and \(y\text{,}\) we can ask if a given point is a solution to that equation. By the graph of an equation, we mean the collection of all the points \((x,y)\text{,}\) that satisfy the equation. As an example, consider the graph labeled \(L\) below.
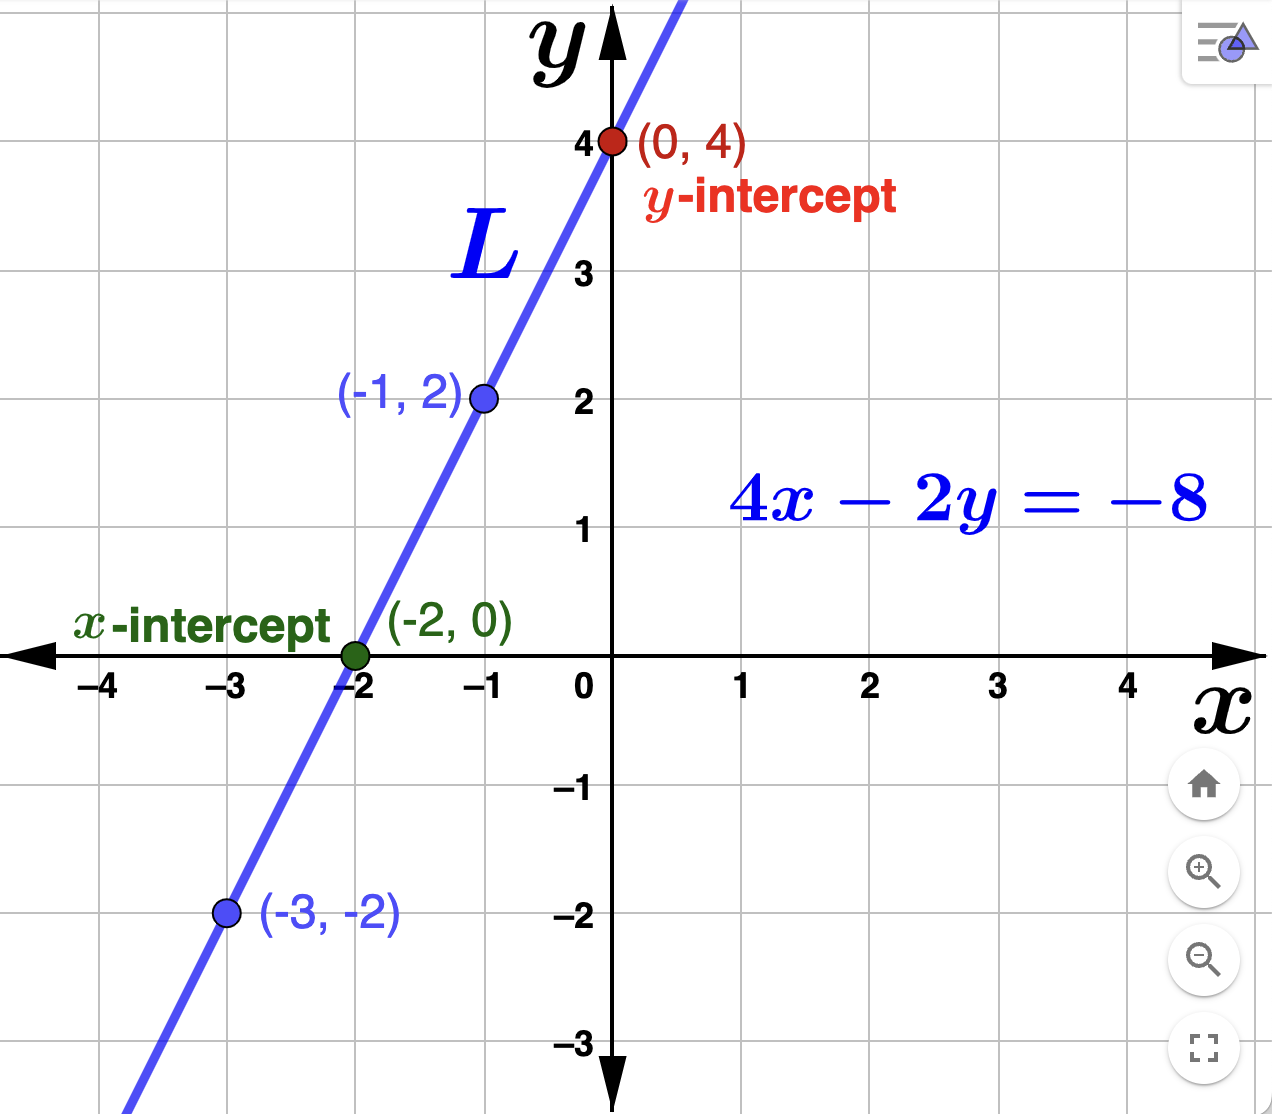
\(L\) is the visual representation of the graph of \(4x-2y=-8\) in the plane. For homework check that each point labeled on the graph satisfies the equation defining \(L\text{.}\) Note that \((0,4)\) is called the \(y\)-intercept and \((-2,0)\) is called the \(x\)-intercept (the points where the graph crosses the coordinate axes). Is the point \((5,6)\) on the graph?
Example 1.1.2.