Section 2.2 Graphs of Functions
Points on the graph of a function \(f(x)\) have the form \((x,f(x))\) where \(x\) is in the domain of \(f\text{.}\) Notice that these points have the form (domain value, range value). So, the domain values are on the \(x\text{,}\) or horizontal axis, and the range values are on the \(y\text{,}\) or vertical, axis. The points where the graph touches or crosses an axis are called intercepts.
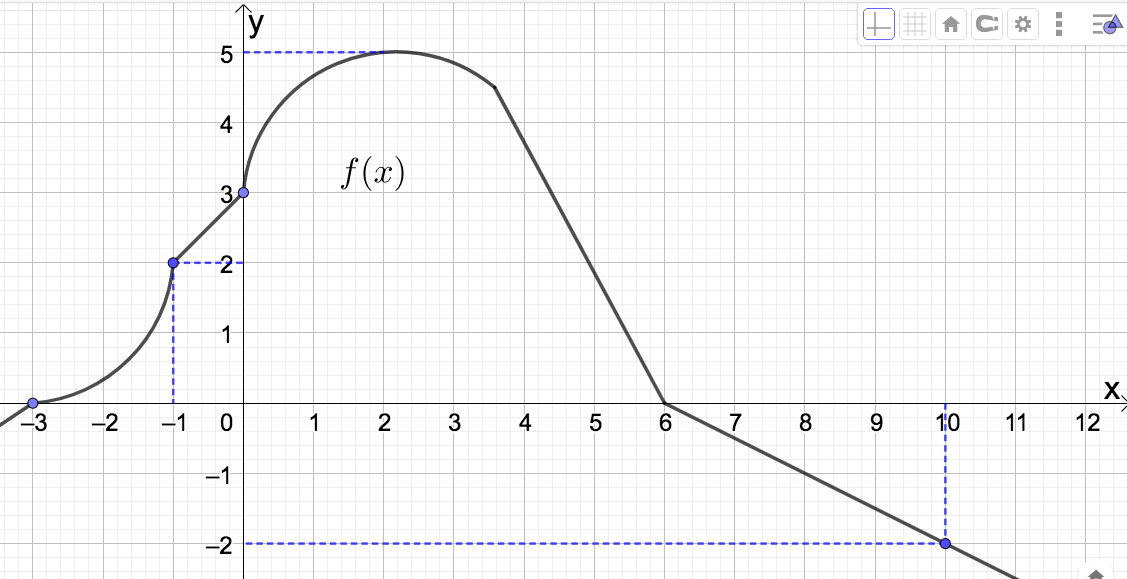
- Find \(f(-1)\text{.}\) Solution.\(f(-1) = 2\) since the point \((-1,2)\) is on the graph of \(f(x)\text{.}\)
- Find \(f(10)\text{.}\) Solution.\(f(10) = -2\) since the point \((10,-2)\) is on the graph of \(f(x)\text{.}\)
- Find the \(x\)-intercept(s) or determine that there are none. Solution.Since the horizontal axis is labeled \(x\text{,}\) these are the points where the graph crosses the horizontal axis. These points are\begin{equation*} (-3,0) \: \textrm{and} \: (6,0) \end{equation*}
- Find the \(y\)-intercepts or determine that there are none. Solution.Since the vertical axis is labeled \(y\text{,}\) these are the points where the graph crosses the vertical axis. This point is \((0,3)\)
- Find the domain of \(f(x)\text{.}\) Solution.We look at the horizontal (or \(x\)) axis to determine this. Since every number on the \(x\)-axis has a point above or below it on the graph (think about drawing vertical lines through numbers on the horizontal axis), \(\textrm{dom}(f) = \mathbb{R} = (-\infty,\infty)\text{.}\)
- Find the range of \(f(x)\text{.}\) Solution.We look at the vertical (or \(y\)) axis to determine this. Since every number below and including 5 on the \(y\)-axis has a point on the graph to the right or left of it (think about drawing horizontal lines through numbers on the vertical axis) \(\textrm{rng}(f) = (-\infty,5]\text{.}\)
Remember that if \(f\) is a function between sets, then input values correspond uniquely to output values. In other words, for every input value, there is only one ouptput value. Geometrically, this means that if you locate a domain value on the horizontal axis of the graph of \(f\text{,}\) then there is exactly one point on the vertical line through that domain value. This gives us the following geometric test to determine if a graph represents a function.
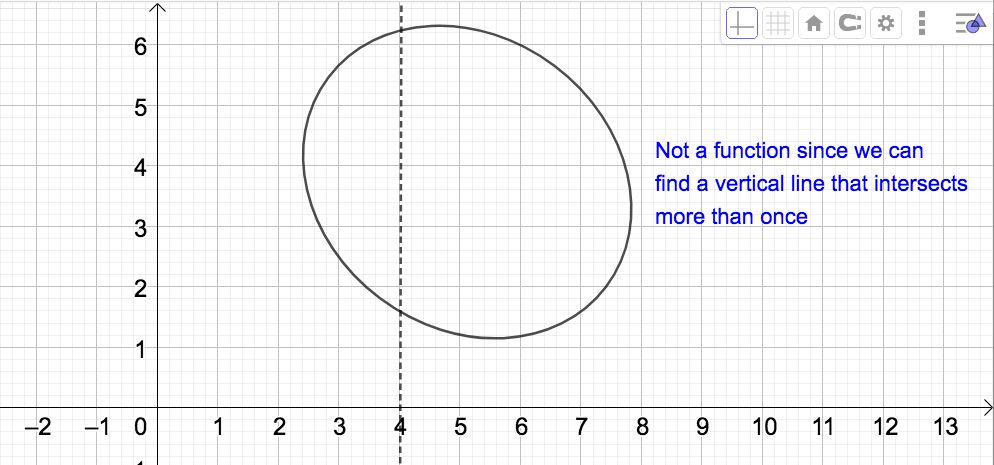
The Vertical Line Test (VLT): A graph represents a function if and only if any vertical line intersects the graph AT MOST once.
Example 2.2.2.
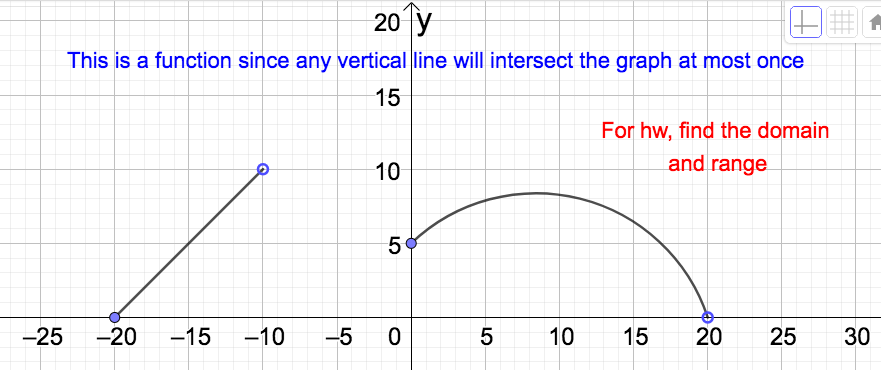
- Graph given below. Because any vertical line will intersect this graph at most once, this graph represents a function. Note that there are open circles at the points \((-10,10)\) and \((20,0)\text{.}\) For homeowork find the domain and range of this function.
- Graph given below. Because a vertical line can be drawn that intersects this graph more than once (for instance \(x=4\)), this graph DOES NOT represent a function.